Interactive preview
What the output looks like.
Actual dashboard output from a fictional demonstration client — NovaPay SE, 4 offices, 127 FTE — built end to end to validate the pipeline. Same dashboard structure, same data-quality rigor, same report format a real engagement produces. No client data is shown anywhere.
Raw data in · traceable ESG intelligence out
Data → Validation → Calculation → Dashboard → Reporting
Collect
From multiple sources — CSVs, invoices, HR exports, travel logs, utility bills.
Validate
Duplicates, missing fields and format checks before anything is calculated.
Calculate
Country-specific emission factors, mappings and QA rules — one auditable engine.
Visualize
A refreshable Power BI dashboard across emissions, energy, water and workforce.
Report
ESRS-ready narrative, audit trail and export documents.
Every calculated metric is traceable back to its source activity and the exact factor applied.
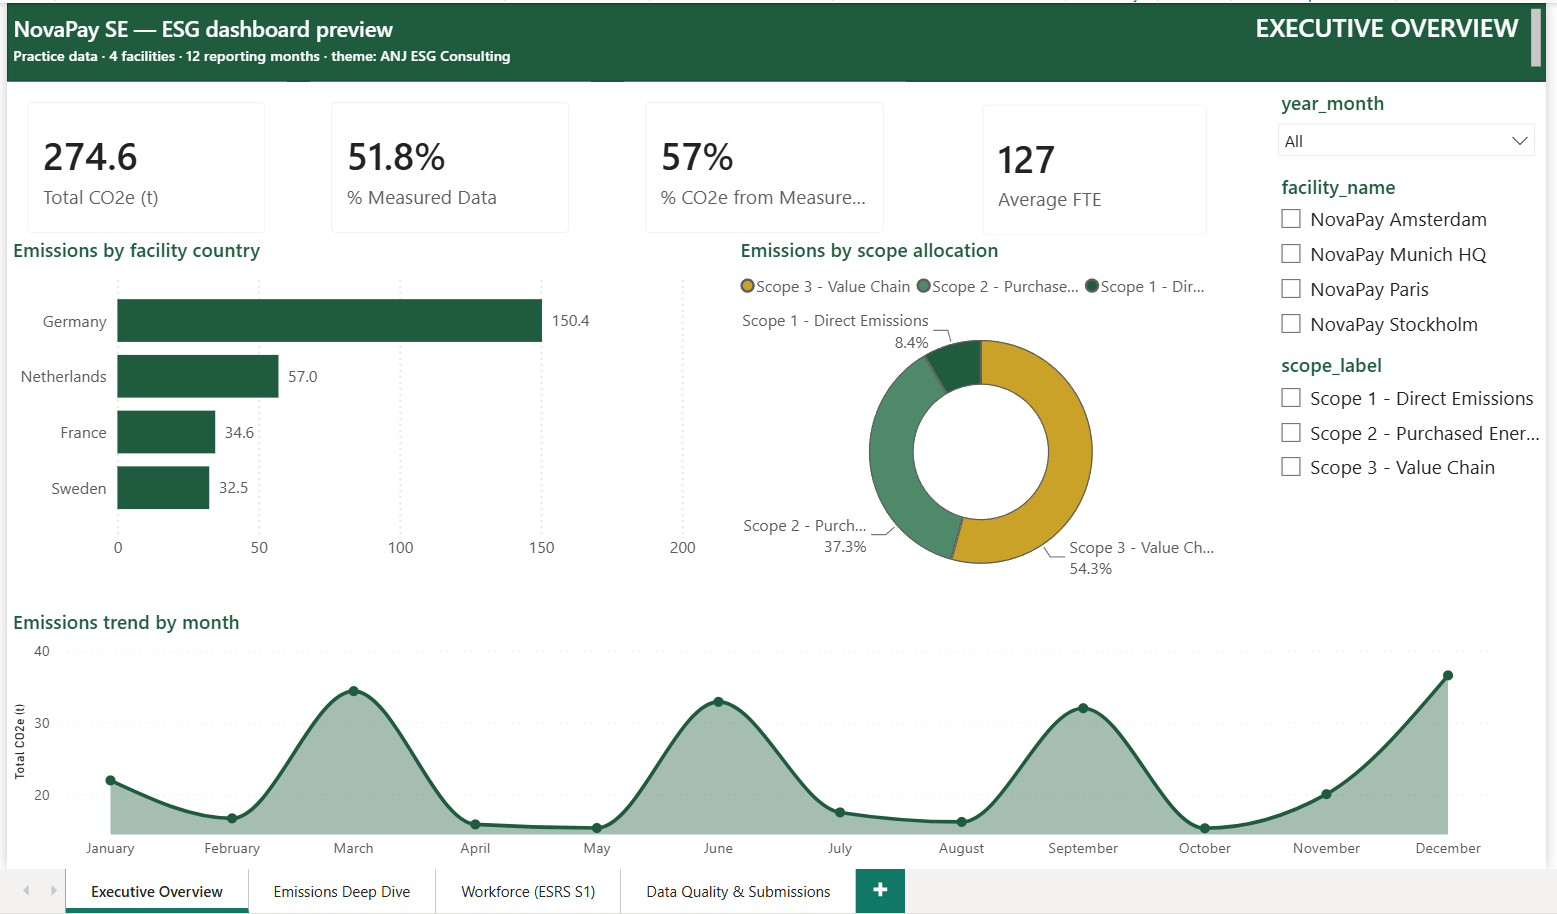
Executive overview
footprint by scope, country and month, with data-quality KPIs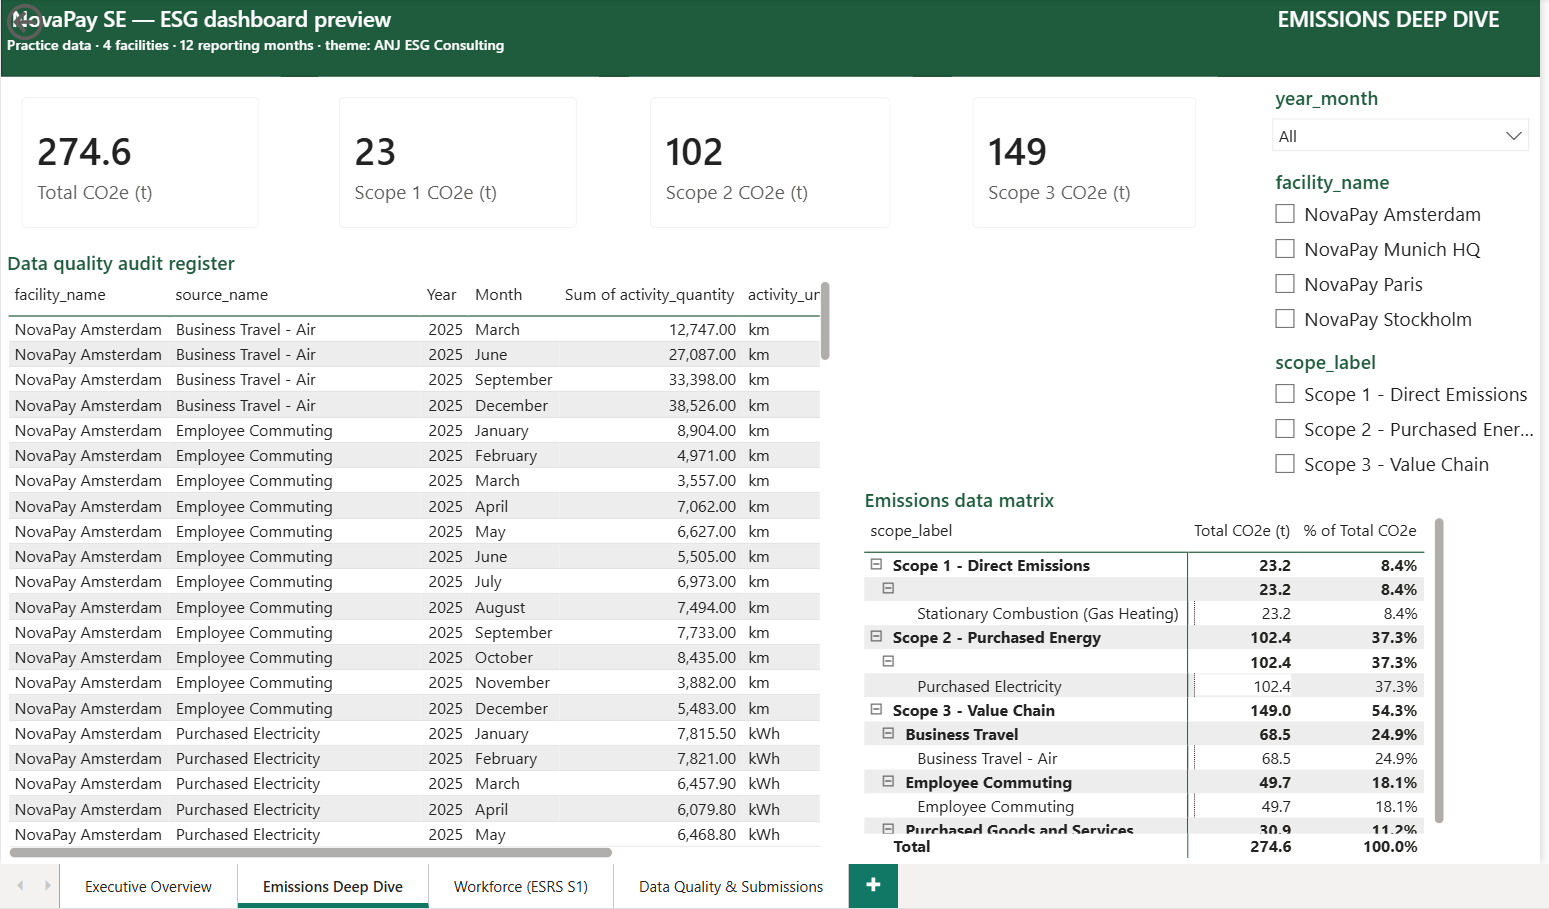
Emissions deep dive
every figure traceable to its source row and the exact emission factor appliedWhat you receive
Every deliverable in one system.
Interactive dashboard
Footprint by scope, source, facility and country; workforce metrics; data-quality tracking your auditors and investors can interrogate.
CSRD-aligned narrative report
ESRS E1, S1 and G1 — written for voluntary disclosure, for investors and customers as much as auditors.
Gap assessment
Where your data is strong, where it is estimated, and the improvement path.
Full traceability
Every emission figure links back to its source data and the exact factor applied, with country-specific factors for every European market you operate in.
Monthly continuity
A refreshed dashboard and a one-page insights memo by the 10th of every month, plus support for investor and customer ESG questionnaires as they arrive.
See the full preview
The complete three-page readiness preview, including both dashboards and the deliverables walkthrough.
Download preview (PDF)Curious what this looks like for your company?
Reply with your team size and the markets you operate in, and you'll get back a specific, honest read on whether this is worth doing now or later. No discovery call, no sales deck.
or email anjali@anjesgconsulting.com